
Unleash Your Digital Potential
Talk To US

Talk To US


Four channels, four P&L logics, one average that keeps the burn out of sight. Why contribution margin by channel, not blended CAC, is the number a D2C brand actually runs on.
Every scaled D2C brand has a number it can recite from memory. Blended CAC sits at the top of the weekly deck, moves a few percent either way, and as long as it stays inside a familiar band, nobody asks a second question. That is exactly the problem. The number is not wrong. It is something worse. It is reassuring.
Blended CAC is stable because it is built to be stable. It averages every channel's economics into one figure, and in doing so it cancels the one signal a founder actually needs: which channel is compounding, which channel is burning, and how fast.
A brand at scale in India is rarely one business. It is four selling motions running at once, and each one books revenue and cost on its own rules. On marketplaces, take rates, platform advertising and settlement lag are all set by the platform. On the own site, paid traffic flows in while RTO and shipping risk flow out, which means the margin often exists only on paper. Quick commerce trades listing fees and visibility spend for velocity. Offline runs on distributor margins and trade schemes, reported quarterly.
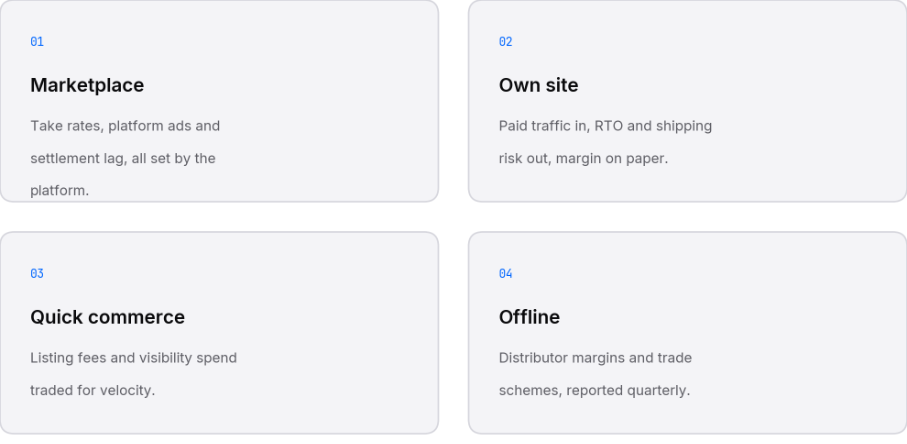
Four incompatible P&L logics, collapsed into one blended average. That is the arithmetic most weekly decks are built on.
Averaging is not neutral. Blended CAC nets the channel that compounds against the channel that burns. A compounding channel shows CAC falling and repeat orders rising. A burning channel shows CAC rising and margin turning negative. Blend the two and the output is one calm number with two opposite stories inside it.
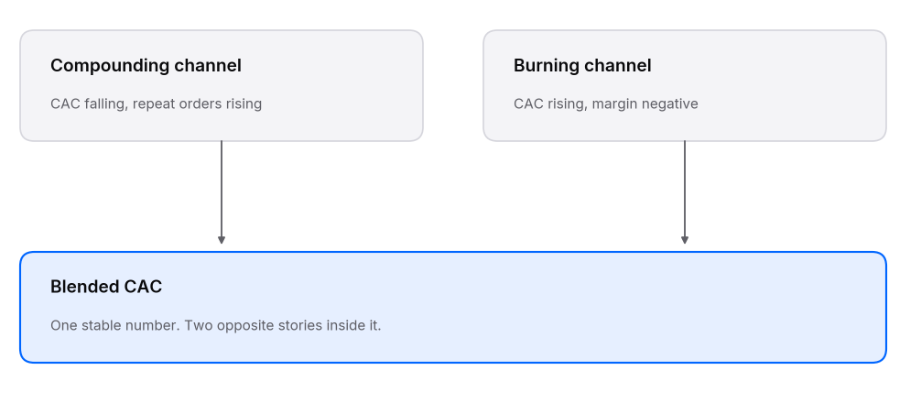
Worse, the average moves last. A single channel can deteriorate for months before it drags the blend visibly off course. By the time blended CAC finally turns, the burn is quarters old and the cash is already gone.
Here is an illustrative month for one brand. Marketplace CAC lands at Rs 620, quick commerce at Rs 940 and the D2C site at Rs 1,450. The blended figure reads Rs 850 and sits comfortably in the middle.
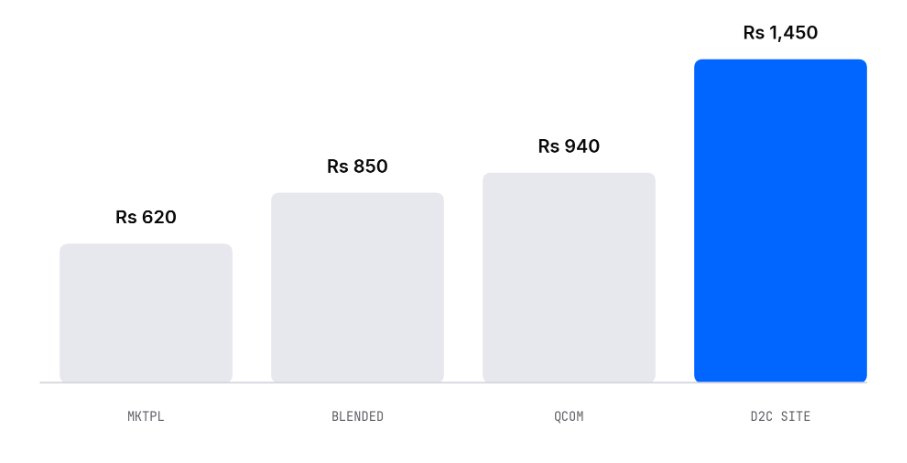
Report the blended bar alone and the tallest one never reaches a meeting. The channel acquiring customers at Rs 1,450 keeps its budget, its agency and its targets, because the average absorbed it.
The number that deserves the meeting is contribution margin per order, per channel, net of RTO and platform deductions. It answers the only question that matters at the unit level: after the channel takes its share back, what does the order actually keep?
Walk a Rs 1,000 order through it. After platform fees the order holds Rs 780. After RTO and returns it holds Rs 640. Once COGS, freight, packaging and gateway costs land, it keeps Rs 310.
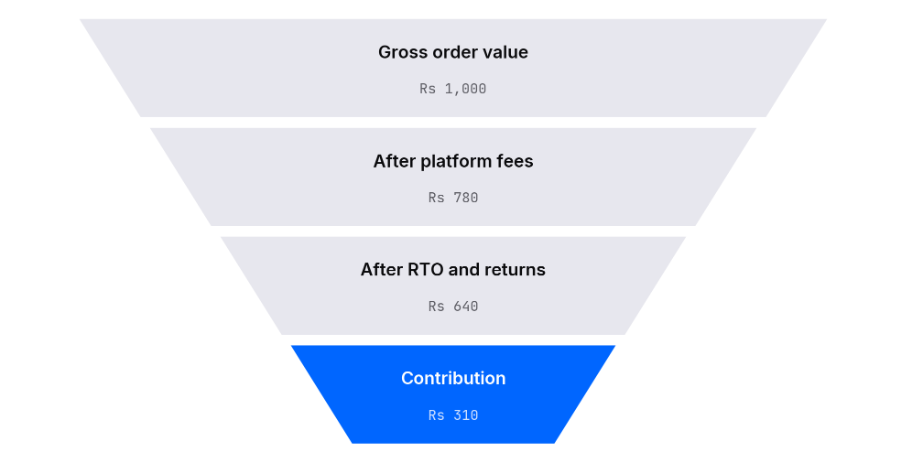
Run that funnel per SKU, per channel. The ranking it produces will not match your CAC ranking, and the gap between the two lists is where the money is leaking.
This is where blended reporting truly breaks. Contribution per unit is not a property of the SKU. It is a property of the SKU and channel pair. The hero 50 ml earns Rs 212 on marketplace and loses Rs 41 on the D2C site. The festive gift set loses Rs 73 on D2C yet clears Rs 12 on quick commerce. The trial pack loses money on marketplace and earns it on the site.
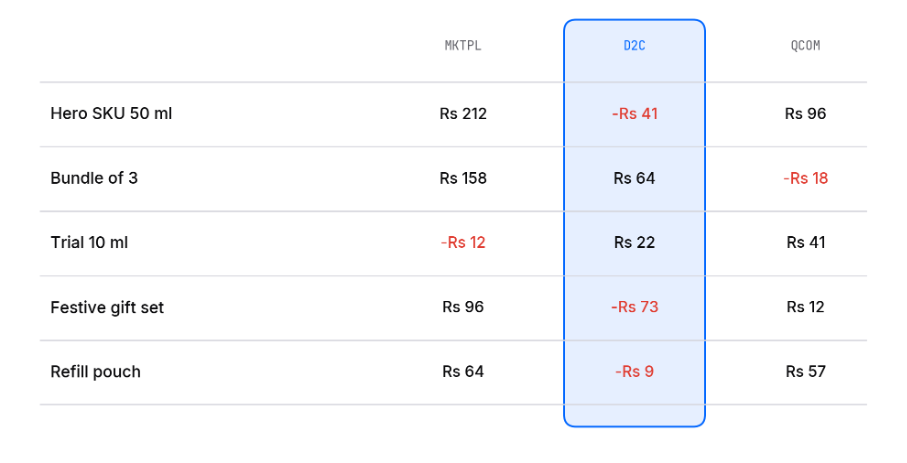
One blended number approves all fifteen cells in this grid. The grid disagrees in five of them. Every one of those five cells is a live decision: delist, reprice, rebundle, or move the SKU to the channel where it works.
If contribution by SKU by channel is this decisive, why do so few brands run on it? Because producing it is a project. Settlement files are exported from every marketplace and quick commerce portal, one by one. SKU codes, orders and returns are reconciled across systems by hand. RTO, freight and platform fees are allocated over SKUs in a spreadsheet. What finally lands is a static report, already stale the day it ships.
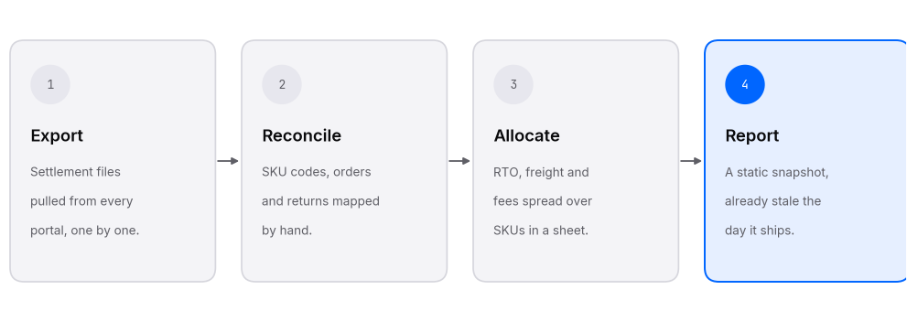
Most brands cannot produce the grid in under a week, so it gets produced once a quarter, argued over once, and shelved. By the time the snapshot lands, the quarter it describes has moved on.
The fix is not a better spreadsheet. It is a pipeline that turns the question into a filter instead of a project.
Every channel feed, marketplaces, D2C storefront, quick commerce and offline, lands raw on one schema in a martech database. A warehouse layer applies one governed P&L model on top: orders, returns, fees and COGS reconciled the same way every day. BI dashboards then serve contribution by SKU by channel, refreshed daily, to everyone who spends money.
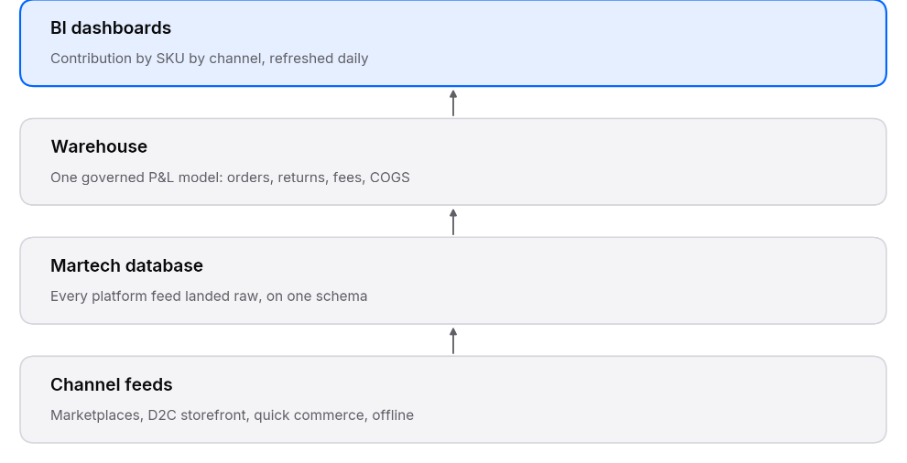
This is the build Avidus Interactive delivers for D2C brands: the martech database, the warehouse model and the BI dashboards, built once and governed daily. After that, asking what a SKU keeps on a channel stops being a quarterly debate and becomes a dropdown.
A number you cannot split by channel is not a metric. It is a sedative. Blended CAC still belongs in the deck, as a summary. It just cannot be the number the business runs on, because the decisions that create or destroy margin, budget shifts, delistings, pricing and bundling, all happen one channel and one SKU at a time.
If your blended CAC has looked comfortable for three straight quarters, that is not necessarily good news. It may simply mean the uncomfortable number has nowhere to show up.
Avidus Interactive builds the martech database, warehouse and BI dashboards that keep contribution margin by channel live for D2C brands. Talk to us at https://cal.com/team/avidus-interactive/quick-intro


